Value at Risk Measures:
1. The Amount of Potential Losses
2. The chance of that loss
3. The Time Frame of the Loss
Calculation, Significance and Use of Value at Risk (VaR) Measures
Value at Risk is one unique and consolidated measure of risk, which has been at the center of much expectations, popularity and controversy. It is also referred to as a summary statistic which quantifies the asset or portfolio’s exposure to market risk. It has been in the news for many wrong reasons as much popularity it gained among the financial market dealers since 2008 wall street crash.
Later economists and analysts have been able to develop more comprehensive and reliable VaR stats but the basic characteristic of all the measure remains the same or at least they are derived from Traditional VaR statistic. Here we will take a look at what are the qualities which made this statistic gain popularity and notoriety at the same time.
Features of Value at Risk (VaR): Given below are features of Traditional VaR estimate:
- VaR is probability based and allows the users to interpret possible losses for various confidence levels.
- It is a consistent measurement of financial risk as it uses the possible dollar loss metric enabling the analysts to make direct comparisons across different portfolios, assets or even business lines.
- VaR is calculated based on a common time horizon, and thus, allows for possible losses to be quantified for a particular period.
The choice of confidence level is usually based on the industry requirements or reporting norms suggested by the Regulators. Choice of time horizon will depend on the type of asset being analyzed, for example:
- On a common stock it can be estimated for any horizon depending on the frequency of trade or user requirement.
- On a portfolio VaR can be calculated for a period of turnover only; i.e. till the time portfolio holdings remain consistent, as the holding changes or in other words if a trade is recorded in the portfolio the VaR has to be calculated again. Therefore, time-horizon for a portfolio depends on the frequency of trading in its assets.
- For a business analysis it may depend on the employee evaluation periods, key decision making events etc. could provide the possible time horizons.
- Regulatory and taxation requirements
- External Quality Assessments etc.
It is important to note that VaR comparison between two portfolios, business lines or assets requires that the two variables, i.e. time horizon and confidence level, be consistent for all the portfolios being compared.
Calculating Value at Risk (VaR)
The methods used for calculating VaR actually hold the key to the reliability of the estimate. Also various methods can be used to calculate the possible value at risk on the same time horizon, depending on the availability of the data.
For example: If VaR is calculated for a very short horizon, say intraday, amount of data may be too small to provide a consistent or reliable answer, but it may not be possible to include additional actual data (due to trade changes or other restrictions). In such cases sample size has to be artificially increased using methods of re-sampling to create enhanced view of the current situation and increase the reliability of the VaR.
Methods to Calculate VaR: Starting from the basic methods we shall move to more complex ones, readers should keep in mind that the examples provided in the article do not constitute any advice or a real life scenario. They are meant only to provide a basic understanding and general idea about the framework of VaR calculations. Real life solutions may be a lot more complex.
Historical Method
This is the most basic of all, and perhaps the most simple to use as well, though it carries a few disadvantages for the analyst:
- It requires large amount of data, usually 3 years or more.
- It uses only Historical data for risk measurement which may not hold true for future conditions.
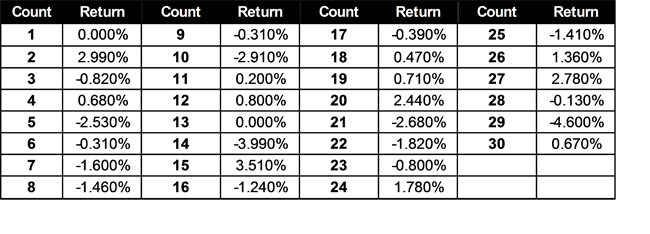
As we can see there are 30 set of values provided here indicating daily returns on a stock. To calculate VaR through this method simply arrange the returns in ascending order and count –
- For 5% Daily VaR count the least 5% of the returns out of 30 values, which will be the 1.5th
- For 1% daily VaR count the least 1% of the returns out of 30 values, which shall be 0.3rd value.
In counting method as VaR is going to measure portfolio risk, we can round the values to the next or nearest standard value, therefore:
- 1.5th value can be taken the second lowest return which is -3.99% &
- 0.3rd value can be taken as the lowest return in the series, which is -4.60%
To see how the distribution appears or to check the normalcy of the distribution we can use the Data Analysis tool pack in excel to create a frequency table like the one prepared below:
| Bin |
Frequency |
| -4.60% |
1 |
| -2.98% |
1 |
| -1.36% |
7 |
| 0.27% |
10 |
| 1.89% |
7 |
| More |
4 |
And then plot it on the chart:
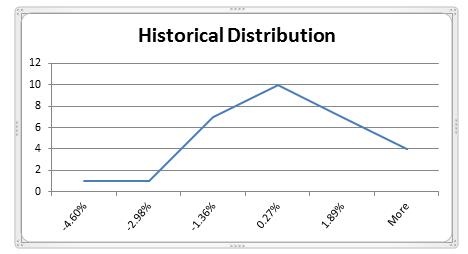
Figure 1: Distribution of Historical Returns
Interpretation of Historical VaR
Going forward VaR can be interpreted in two ways:
1. As minimum loss possibility, for example: 5% VaR for the above example can be put like this- “there is 5% chance for the portfolio of incurring a loss of 3.99% of the total portfolio value in a day or say tomorrow (only in case of daily VaR).”
2. As a confidence level measure, for example: “for the same 5% VaR it can be said that there is 95% chance that the portfolio will not lose more than 3.99% of its total value in a day’s trade.”
The second interpretation is the one majorly used by portfolio managers, and can sometimes be misleading as it ignores the higher loss percentages on the left tail of the measured VaR, that is why, most of the times regulators and other market supervisors prefer to look at both 5% and 1% VaR measures instead of just either one of them.
Calculating VaR for a Portfolio: To calculate VaR for a portfolio which consists of multiple securities or assets, the best way is to calculate individual asset distributions for the period say ‘daily’ and then calculate relative portfolio values for each day. Afterwards, these consolidated portfolio return can be distributed just like the historical data above to calculate portfolio VaR.
Example: Suppose the returns taken in the example above are end of the day results of stocks A, B, C and D with respective initial weights of 20%, 30%, 10% and 40% respectively. Then before we can calculate VaR for the portfolio we need to assess the individual asset returns and their weighted impact on the overall portfolio:
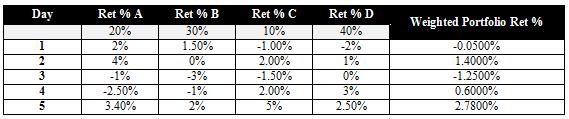
Table: The weighted portfolio return can be plotted for Historical VaR calculation of the portfolio distribution.
Uses of Value at Risk (VaR)
VaR has four main uses in finance:
- Risk Management
- Financial Control
- Financial Reporting and
- Computing Regulatory Capital.
VaR is sometimes used in non-financial applications as well.
The greatest benefit of VAR is that it imposes a structured methodology for critically measuring risk. Institutions that go through the process of computing their VAR are forced to keep a check on their exposure to financial risks and to set up a proper risk management function. Thus the process of getting to VAR may be as important as the number itself.
The other benefit of VaR is that it allows organizations to divide risk in two parts.
- Inside the VaR Limit
- Outside the VaR Limit
"A risk manager has two jobs: make people take more risk the 99% of the time it is safe to do so, and survive the other 1% of the time. VaR is the border. So by using VaR the limit of the Risk that can be undertaken is defined.
In the early 1990s, three events dramatically expanded use of value-at-risk:
- The Group of 30 (1993) published a groundbreaking report on derivatives practices. It was influential and helped shape the emerging field of financial risk management. It promoted the use of value-at-risk by derivatives dealers and appears to be the first publication to use the phrase “value-at-risk.”
- JP Morgan (1994) released the first detailed description of value-at-risk as part of its free Risk Metrics service. This was intended to promote the use of value-at-risk among the firm’s institutional clients. The service comprised a technical document describing how to implement a VaR measure and a covariance matrix for several hundred key factors updated daily on the internet.
- In 1995, the Basel Committee on Banking Supervision implemented market risk capital requirements for banks. These were based upon a crude value-at-risk measure, but the committee also approved, as an alternative, the use of banks’ own proprietary VaR measures in certain circumstances.
Criticism of VaR
VaR is compared to "an airbag that works all the time, except when you have a car accident."
The major criticism of VaR is:
- Led to excessive risk-taking and leverage at financial institutions
- Focused on the manageable risks near the center of the distribution and ignored the tails
- Created an incentive to take "excessive but remote risks"
- Was "potentially catastrophic when its use creates a false sense of security among senior executives and watchdogs."
Limitation of VaR
These are some common limitations of VaR:
- Referring to VaR as a "worst-case" or "maximum tolerable" loss. In fact, you expect two or three losses per year that exceed one-day 1% VaR.
- Making VaR control or VaR reduction the central concern of risk management. It is far more important to worry about what happens when losses exceed VaR.
- Assuming plausible losses will be less than some multiple, often three, of VaR. The entire point of VaR is that losses can be extremely large, and sometimes impossible to define, once you get beyond the VaR point. To a risk manager, VaR is the level of losses at which you stop trying to guess what will happen next, and start preparing for anything.
- Reporting a VaR that has not passed a backtest. Regardless of how VaR is computed, it should have produced the correct number of breaks (within sampling error) in the past. A common specific violation of this is to report a VaR based on the unverified assumption that everything follows a multivariate normal distribution.
To know more about Value at Risk and Risk Management Measures you can pursue the
Accredited Financial Analyst Designation Program
of AAFM USA.
To know more Fill the:
‘Join US’ Form on this Page
Please leave your Comments below and If you found this article Helpful Share it on Social Media.
Important Links
Additional Reading:
- VaR Through Analytical Method or Variance- Covariance Method
- Monte Carlo Simulation for VaR Calculation
- Calculation of VaR through Bootstrapping Simulation
|